Answers
EV vs. Gas Running Costs: What the CAA EV Circuit Found
Results from CAA’s electric vehicle test event reveal how EV range, energy efficiency and charging costs compare with gas-powered vehicles, and why where you charge matters.

Oct 15, 2026
5 min. read
We learned some valuable — and occasionally surprising — lessons about real-world EV range, charging speed and driving costs after crunching the numbers from the recent CAA EV Circuit.
“CAA has been part of a mobility strategy for over 100 years, so we've got a century’s worth of advocacy work behind us, trying to get information for consumers, for our Members,” says Anita Mueller, senior vice-president of Club & Automotive at CAA Club Group.
The EV Circuit is an extension of the Club’s mission to help drivers, she explains. As gas prices rise, Mueller adds, more everyday drivers — people who aren’t typically looking at the newest cutting-edge vehicles — are trying to figure out if an EV could work for them.
It’s been about 15 years since the first mass-produced EVs showed up in Canadian car dealerships, but, as of 2026, EVs account for only 2.8 percent of the nearly 27 million light-duty vehicles that roam Canada’s roads. This is still unfamiliar technology for most drivers.
So if you’re thinking about making the switch to an EV, wondering how much fast-charging costs or considering what EV driving range is like, you’ve come to the right place.
First, a quick reminder: the EV Circuit wasn’t a scientific test. Take these results as a snapshot of the state of EVs in 2026. Every driver’s situation is different; your mileage, and costs, will vary.

EVs Beat ICE on Efficiency, but Size Matters
Of the 22 EVs that completed this 230-km trip around winding country roads, suburban streets and busy highways of southern Ontario, every one of them could have comfortably completed the drive without recharging. In fact, on average, the vehicles used just 40 percent of their batteries’ capacity to complete the journey. If you haven’t checked out an EV in a while, you might be surprised by how much driving range they have these days.
Some of the vehicles — such as the Chevrolet Silverado EV and Hummer SUV — were just getting warmed up, respectively using just 20 and 32 percent of their batteries. That result speaks to the truly massive batteries that power those behemoths. The Silverado’s 205 kWh battery is double or even triple the size of other vehicles on the EV Circuit.
But bigger batteries don’t translate directly into more range; efficiency is the name of the game. And in that category, EVs are the clear winners.
On average, the 22 EVs on the Circuit were roughly 4.6 times more energy efficient than the average internal combustion engine (ICE) vehicle. The EVs used an average of 16.6 kWh/100 km, which is the energy equivalent of about 1.9 litres of gasoline per 100 km (Le/100 km). For the sake of comparison, we’re assuming an average gasoline vehicle burns 8.5 L/100 km. (That number is just under the International Energy Agency’s latest available data for Canada.)
Averages, however, can hide wide variations. With any vehicle, its size, weight and performance play a huge role in efficiency, and therefore also on running cost.
Sedans and hatchbacks were the efficiency champions, averaging 13.5 kWh/100 km (1.5 Le/100 km). But it’s interesting to note that subcompact and compact SUVs weren’t far behind at all, averaging 13.7 kWh/100 km (1.5 Le/100 km).
Full-size and three-row SUVs used more energy, but a standout in that crowd was the Hyundai Ioniq 9. It used just 15.5 kWh/100 km (1.7 Le/100 km), which is quite impressive for such a large, family-friendly vehicle. During our test drive, it used less energy than the compact BMW iX3 SUV, which itself returned a respectable 16.6 kWh/100 km (1.9 Le/100 km).
Pickup trucks used more energy; the Tesla Cybertruck, for example, consumed 23 kWh/100 km (2.6 Le/100 km). The Chevrolet Silverado EV fared much better, at 17.2 kWh/100 km (1.9 Le/100 km), which is incredibly impressive for a full-size pickup.
Mild Temperatures Help Maximize Efficiency
It was a mild fall day in mid-September when we gathered at the Blue Mountain Resort near Collingwood, Ontario. Those moderate temperatures certainly helped increase efficiency. As CAA has already noted, these EVs consumed about 40 percent less energy, on average, than the EVs in last year’s Winter Test, which was conducted in temperatures ranging from -7°C to -15°C.
“The driving range and efficiency part of this test wasn't a worst-case scenario; I would describe it as a good-case scenario,” says Kurt Sampson, EV expert at CAA Atlantic.
EV vs. ICE Running Costs: Location, Location, Location
The EV Circuit looked specifically at energy efficiency to answer a common question: how do ICE refuelling costs compare to EV recharging costs in a road-trip scenario? This is a worst-case situation for EVs, because public fast chargers are by far the most expensive way to recharge.
Not only that, but most of the vehicles’ batteries hadn’t depleted enough for optimal fast charging. That had the dual effect of slowing charging speeds and driving up the cost per 100 km of added range. Like we said, this is a worst-case scenario for EVs, but one plenty of drivers could encounter in the real world.
On this occasion, it cost an average of $14.30 for a 15-minute session at a Tesla Supercharger station. For the EVs on the Circuit, that works out to an average of $13.50 for 100 km of estimated driving range.
Even in this high-priced charging scenario, it’s still slightly cheaper on average to recharge than to refuel an average ICE vehicle (assuming 8.5 L/100 km at current gas prices of 179.3 cents per litre).
Diving deeper into the results, 14 of 20 EVs were cheaper than an ICE vehicle in this scenario. (Two EVs had no cost recorded. The Polestar 4’s aftermarket charge-plug adapter apparently failed, and the Lucid Gravity’s session was free.)
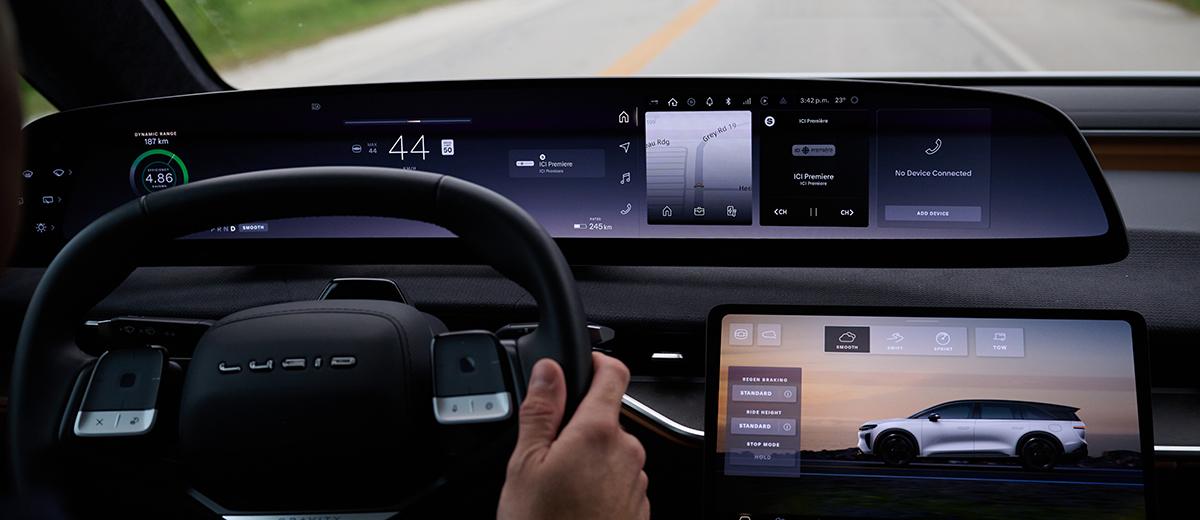
Six EVs cost more than an average ICE vehicle while charging during the event. Unsurprisingly, they were all bigger, less energy-efficient models: Hyundai Ioniq 9, VW ID. Buzz, Cybertruck, Rivian, Silverado EV and the Hummer. The gargantuan Hummer cost a whopping $24.39 per 100 km at these fast chargers, but nobody is buying a $135,000 SUV to save money.

“Our last CAA EV Drivers Survey found that only about eight to 18 percent of EV charging is done this way [at public fast chargers] with the vast majority of EV charging done at home,” Sampson notes.
If you’re charging at home overnight, based on Ontario’s off-peak electricity rate of 9.8 cents per kWh, you’d save approximately $2,725 in annual running costs over 20,000 km. And even if you’re charging 13 percent of the time at an expensive public fast charger, you’d still be saving about $2,400 per year driving an EV versus a car with an internal combustion engine. Note that electricity rate is the pure electricity cost, not including delivery charges and fees.
Sampson also warned that fast-charging prices do vary a lot across Canada, so the prices noted in this article should be used for informational purposes only. And the fast-charging rates we saw on the EV Circuit are far from a best-case scenario. Again, this wasn’t a scientific test. There are a number of variables — including weather, charging location, driving route, time of day, driving style and more — that go into real-world driving costs.
To help figure out what type of vehicle works best for you, you’ll want to run the numbers yourself using CAA’s Driving Cost Calculator.
Read our recap of the 2026 EV Circuit.
Share this article:
Filter by